In some cases, you can make your debugging much easier if you debug CIL instead of the original X++ code. Working with collection classes (lists, maps, etc) is such a case.
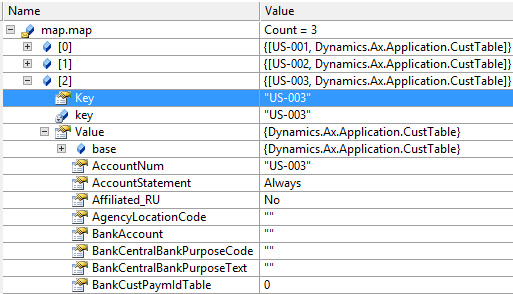
For example, the following picture shows a map (mapping customer IDs to CustTable records, e.g. for caching) as displayed by the AX debugger:
![]()
If you do the same thing in CIL / Visual Studio debugger, it looks almost the same:
![]()
But there is one huge difference – unlike in AX, you can actually open the content of the collection. You can easily see the number of elements and you can open any of them and see the full object graph (such as fields of CustTable records, in our case).
The inability to see the content of collections in AX debugger can be quite annoying. You can’t simply see what’s inside; you need some code that explicitly iterates the collection. Debugging the CIL code instead of X++ can be much easier.
By the way, you can dig into many other things that looks atomic in X++. For example, utcdatetime is a primitive type in X++, but it’s a struct in CIL and you can see many properties unavailable in X++:

