Dynamics AX offers many ways how to call .NET code, use .NET GUI components and so on. That’s absolutely fantastic – it gives us easy ways to reuse existing .NET types and frameworks or simply to write a solution in the best fitting language. But as always: “With great power comes great responsibility”.
One potential problem with .NET components is with memory leaks. Although .NET uses garbage collector to release memory allocated by abandoned objects, it obviously can’t do the job if an object is still referenced somewhere. For example, if there is a static field holding a reference, it prevents the referenced object to be collected – unless you remove the reference or the application domain is shut down. Unfortunately it’s often not so easy to localize the problem in a complex application.
I’m currently solving such a problem with one application that I inherited; it’s basically a WPF form integrated in AX2009 via ActiveX, with two-way communication with AX. If you open and close the form (and run garbage collection), the memory should be freed – total memory consumption should be roughly the same before and after running the form. The problem is that almost no memory is actually released – an unmistakable sign of memory leak.
I used ANTS Memory Profiler to analyze the issue – and it did the job quite nicely.
The first step was to define what application to start and with what parameters – it was a Dynamics AX client in this case, but you could choose Windows service to profile .NET code run by AOS, for example.
When you press Start Profiling, the application is started with the profiler attached (or the profiler can be attached to a running .NET 4 process, but that’s not applicable to AX2009 client). Then you simply use the application to execute the parts you’re interested in and take memory snapshots as needed. Later you can analyze the content of any snapshot and compare the differences between two snapshots.
In the figure below you can see one snapshot before opening the WPF form (the blue vertical line in the graph) and another after closing the form (the solid red vertical line). The difference in memory consumption is 55 megabytes – quite a significant amount.
You have quite a lot of options how to analyze the data; the most basic one is on class level. On the Class list tab you can see what classes have the highest number of instances, consume the highest amount of memory and how numbers changed between snapshots. This is an example of three classes with the highest memory consumption in the tested application:

The custom class DM_OpenVisit is highly suspicious here – it holds a lot of data (mostly as strings) and its instances really shouldn’t exist after closing the form. The difficult question is what refers to these instances, because there may be quite a long sequence of references leading to the real culprit and some references don’t have to be very obvious.
What helps is to look at the Instance Retention Graph for some instance of the class:
The graph shows the tree of references that block the instance from releasing. If we followed the left branch, for example, we would reach this reference:
![]()
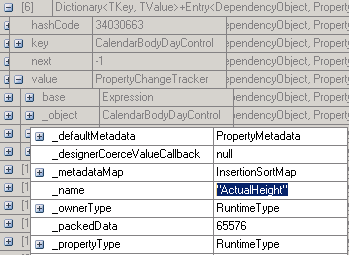
Obviously, something is watching changes of a dependency property. What property it is can be found by expanding details of the Dictionary object:

Then it’s easy to find the code using the ActualHeight property.

It’s nothing new that a use of DependencyPropertyDescriptor may introduce a memory leak. To fix the problem should be easy – the tricky part is to find the source of a leak and it’s obviously not so difficult with a right tool.
The retention graph shows one more interesting thing – the light blue rectangle groups objects that all (indirectly) reference each other. Therefore, any reference to any object in the rectangle prevents all of them from being removed by garbage collector. The implementation uses a single root node holding all data and many other objects refer to the root node, effectively holding all data too. With another design, the same error could have led to a significantly smaller memory leak.
The main lesson for Dynamics AX developers should be that using .NET components brings not only advantages, but also some potential hitches. Not surprisingly, if we want to write and use .NET-based solutions, we have to understand related problems and use appropriate tools to cope with them.


