.NET 4.5 introduced a new way of creating trace events. Such events are created by applications when something interesting happens and they’re especially useful for diagnostics, both functional and performance. Tracing is not a new idea, of course, and many solutions exist even in older versions of .NET framework (e.g. TraceSource). But the new solution offers new capabilities, it’s very easy to use and unlike many other means, it can be used by Windows Store applications.
The relevant types reside in System.Diagnostics.Tracing namespace and the most important class is EventSource. EventSource is what raises events, but you can’t use it directly – you have to create a child class with event definitions, nevertheless EventSource does all the difficult work.
This is a trivial example of a custom EventSource:
MyOwnEventSource : EventSource
{
    public static MyOwnEventSource Log = new MyOwnEventSource();

    public void TaskStarted(string taskName)
    {
        // Call EventSource.WriteEvent() to do all the work
        WriteEvent(1, taskName); // "1" is event ID
    }
}
The event can be than raised by a simple call like this:
MyOwnEventSource.Log.TaskStarted("myTask");
Method names and parameter types and names are important – event listeners will get information about them and you’ll see them in event logs. Also note that only some parameter types are supported: primitive types, strings, Guid and enums. If you used any other type, tracing wouldn’t work.
You can also define event severity, category and such things. It helps to categorize events and listeners may ask only for events with some minimum severity, for example. Simply decorate an event with EventAttribute and set properties as suitable. They include, for instance:
- Level – severity such as Error, Verbose etc.
- Message – formatting string to convert an event to a human readable text.
- Keywords – define groups an event belongs to. You can define your own keywords by creating a nested class called Keywords that will contain constants of EventKeywords type (the same pattern applies also to other properties).
- EventId – you have to pass the right eventId to WriteEvent() and if you don’t set it in EventAttribute, system will assign event ID 1 to the first method, 2 to the second method and so on. If you added a new method on top, subsequent events would be renumbered and send wrong IDs to WriteEvent(). Therefore it’s safer to explicitly assign event ID in EventAttribute. Note that event ID must be unique per trace source.
Example:
[Event(4, Message = "Item skipped: {0}", Level = EventLevel.Warning, Keywords = Keywords.Diagnostic]
public void ItemSkipped(string reason){ WriteEvent(4, reason); }
All methods with void return type are considered events. You can exclude some methods by decorating them with NonEventAttribute. Such methods can have any parameter types, so you can even use them as convenient overloads that accept complex types, convert them to primitive types and call actual events.
[NonEvent]
public void ItemSkipped(Exception ex) { ItemSkipped(ex.ToString()); }
One more useful attribute is EventSourceAttribute – it allows you to set event source’s name. The default name is the class name without namespace, which is often not suitable.
[EventSource(Name = "Goshoom.TestApp")]
class Logger : EventSource
My last tip is that you should check if the event source is enabled before doing anything else, to minimize performance impact if it’s not active. An event will then look like this:
public void ItemSkipped(string reason)
{
    if (IsEnabled())
    {
        WriteEvent(4, reason);
    }
}
Consuming events
You need a tool capable of working with ETW events – my example uses PerfView.
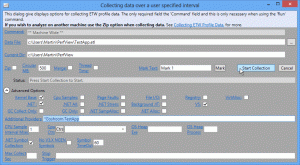
Start PerfView and choose Collect > Collect to explicitly start and stop collection.You could also use Collect > Run to run and trace a specific application, but you need Collect if you work with Windows Store applications.
Configure data to collect and add your event source to Additional Providers. It must be prefixed by star (*). See the picture for an example.
Click Start Collection button, perform all actions you want to trace, return to PerfView and click Stop Collection.
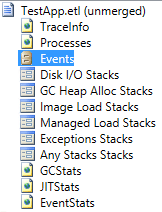
When the log file is ready, open the Events view:

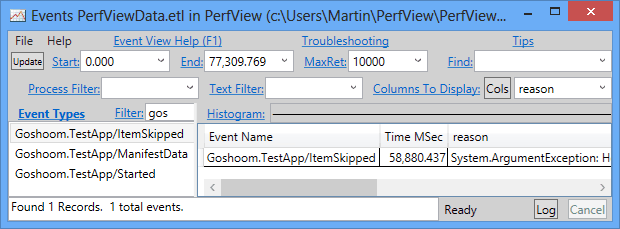
It shows all logged events and you can easily filter them, choose columns to display, see data associated with the event, time of the event and so on.
The picture shows events filtered by name and details of one particular event. You can see that the event source name is Goshoom.TestApp and the event name is ItemSkipped. Column reason was generated based on the parameter of ItemSkipped() method.

Both EventSource and PerfView have much more features than I showed here, but hopefully it gave you some idea. To learn more, try some links that I found useful:
Specification for EventSource class
Vance Morrison’s Weblog
PerfView tutorial on Channel 9
Typo in the code: [NotEvent] should be [NonEvent]
Both occurences fixed. Thank you for pointing it out.